The Kathmandu Durbar Square holds the palaces of the Malla and Shah kings who ruled over the city. Along with these palaces, the square surrounds quadrangles revealing courtyards and temples.


The Kathmandu Durbar Square holds the palaces of the Malla and Shah kings who ruled over the city. Along with these palaces, the square surrounds quadrangles revealing courtyards and temples.

Situated western part in the outskirts of the Kathmandu valley, Seto Gumba also known as Druk Amitabh Mountain or White Monastery, is one of the most popular Buddhist monasteries of Nepal.

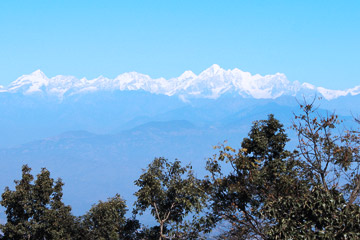
Nagarkot is renowned for its sunrise view of the Himalaya including Mount Everest as well as other snow-capped peaks of the Himalayan range of eastern Nepal.
It is Simple, Clean and Responsive WordPress Theme which automatically adapts to the screen's size.


We were discussing about the project report and thus far this is all that happened .
We’ve completed the visualization aspect of our research. These visualizations depict the connections between the predictor variables and the outcome variable using the test data. Here, obesity and inactivity serve as the predictor variables, while diabetes is the outcome variable. We’ve created plots to represent the relationships between obesity and diabetes, as well as inactivity and diabetes. Furthermore, I’ve determined the R^2 and mean squared error (MSE) values. An R^2 value of 0.395 suggests that approximately 39.5% of the variability in the diabetes data can be explained by the predictor variables. R^2 values can range between 0 and 1, with values closer to 1 implying a better model fit. Meanwhile, the MSE value stands at -0.400063, which measures the average squared difference between the estimated and observed values. A lower MSE typically indicates a better model, although its scale is dependent on the nature of the outcome variable.
Finally submitted my project 2 along with sushant.
”]
No class this week
The issue i am working on this weak is finishing of my work on Identity based political disputes.
They are on a upwards trend and causing a serious issue for the society. Also its biggest rise was during elections, which might show some correlation to elections. with no concrete proof to back it up
I used tableau to generate a Indian map, use different shades for high, moderate and low cases of disputes. Tried to generate another map using GDP has the color shade for state and splitting the IDs as rural and urban to highlight them on the map. But due to problems in splitting the data into urban and rural based fuzzy matching the place name with towns and cities(India) data i found online has made me quit that plan.
started working this new idea about Different types of Identity based violence, why its involved in political based conflicts and its connections
I ran chi-sqaure as told by professor and got some values like:
Chi-Square Test: Region vs Political Violence
Chi² Statistic : 2228.05
Degrees of Freedom : 5
p-value : 0.00000
this sows a strong association with the regions and hence I am confirm that political violence varies a lot based on regions, i shall try to plot it on a map for easier visualization. But chi sqaure compliments the notion.
We were trying to get right correlation between GDP, literacy , ruling parties, and segregating locations to rural, village.
I was using MySQL to work on some separation, trying to find keywords and stuff. later used python to try divide it into rural and urban events. Just noticed some black magic and witch hunting cases in political violence. Trying to find how its related to it.
We finished our project ON police shooting analysis on Different scenarios.
we used different variables like Temperature, population and crime rate to run correlation check on the Police shooting data.
conclusion: Population has major impact on it and temperature doesn’t have and crime is little bit related.
Nikhil: Dataset gathering, word file and Helping in codes
Sowmya: data visualtion and writing code
Today, I dedicated significant time and effort to my work with the crime incident report dataset. Its from the boston analyse dataset It’s been an ongoing project, and I’m currently in the process of developing a robust code to extract specific data related to individual crime from this extensive dataset spanning fewyears.
One of the exciting aspects of my work is the visualization part. I’m actively working on creating code that will allow me to plot graphs using latitude and longitude data parameters. These visualizations will provide a dynamic view of how crime incidents are distributed across the city of Boston. It’s a challenging task, but it promises to reveal valuable insights into crime patterns and hotspots within the city.
I was actively engaged in analyzing a criminal dataset. Initially, we divided the dataset into a training set and a test set to facilitate our analysis. During this phase, I calculated various statistics, including crime rates, for each geographical region and identified key features and target variables for a predictive model.
Subsequently, we leveraged the test set to make predictions related to crime rates, employing a machine learning algorithm tailored for this purpose. Our script seamlessly integrated data visualization tools, such as matplotlib, to create informative plots and charts that showcased the relationships and trends within the criminal data.
Analyzing crime data through geospatial analysis is an essential approach for understanding and addressing crime-related challenges in various regions. This technique involves the examination and visualization of crime data on maps, harnessing technologies such as geographic information systems (GIS), satellite imagery, and GPS data. It enables law enforcement agencies, policymakers, and researchers to gain valuable insights, identify patterns, and make informed decisions to enhance public safety.
Crime data geospatial analysis plays a pivotal role in crime prevention and law enforcement. By plotting crime incidents on maps and analyzing their spatial distribution, law enforcement agencies can allocate resources more effectively. They can identify crime hotspots and deploy officers to areas with higher crime rates, thereby increasing the presence of law enforcement where it is most needed.
Moreover, geospatial analysis of crime data is invaluable for identifying trends and patterns in criminal behavior. It can reveal recurring crime patterns, modus operandi of criminals, and correlations between certain environmental factors and crime rates. This information is instrumental in developing proactive crime prevention strategies.
In addition to law enforcement, urban planners and city officials can use geospatial analysis to design safer neighborhoods. By understanding the spatial dynamics of crime, they can make urban planning decisions that contribute to crime reduction, such as improved street lighting, better public transportation, and the strategic placement of public facilities.
Furthermore, researchers and policymakers can use geospatial analysis to evaluate the effectiveness of crime prevention programs and policies. By mapping crime data over time, they can assess the impact of interventions and adjust strategies as needed.
In conclusion, geospatial analysis of crime data is a powerful tool that enhances our understanding of crime patterns, aids in resource allocation, and supports evidence-based decision-making in the realm of public safety and crime prevention. It is a valuable asset for law enforcement, urban planning, and policy development aimed at creating safer communities.
Seasonal Autoregressive Integrated Moving Average (SARIMA) is an advanced model used for time series forecasting, building upon the ARIMA framework by incorporating seasonality. SARIMA consists of three main components: seasonal autoregressive (SAR), seasonal differencing (Seasonal I), and seasonal moving average (SMA). This combination allows for the modeling and prediction of time series data that exhibit recurring patterns over specific time intervals. SARIMA is particularly valuable in scenarios where seasonality plays a significant role in shaping data trends, such as in retail sales, climate patterns, or economic indicators. By addressing both non-seasonal and seasonal dynamics, SARIMA enhances the accuracy of forecasts, making it a versatile tool for analysts and researchers across various domains.
